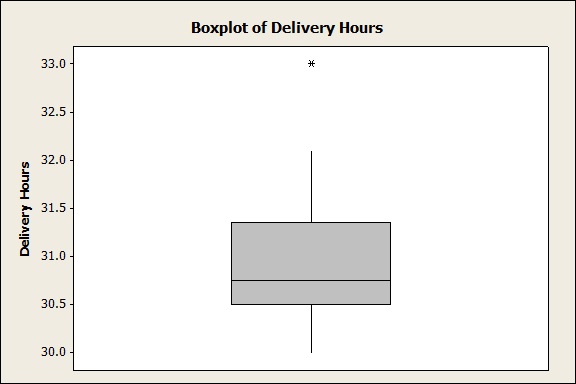
A Box Plot is shown below. What should a Black Belt merely by looking at the Box Plot? Choose the most appropriate option.
OPTIONS
- The Upper Whisker is at 33.0
- The Data could be skewed
- The data forms a normal distribution
- The Lower Whisker is at 30
ANSWER
The Data could be skewed
EXPLANATION
Option a and d are visible from the Box Plot, but in terms of comprehending, this plot tells you that the data is skewed.
